Inventory Reports
Inventory Balance
Overview
This report provides details on the items that are in inventory. This report is consolidated at the department level showing you inventory costs and quantities. Note - this reports only active items, any items which have been made inactive will not appear on this report even if they have quantity.
Handy Hint
- Review your department totals to determine if any slow movers should be combined with fast movers to create packages or to recommend related items at the Point of Sale.
- Open the csv file in a spreadsheet and run a pivot table to compare how much you have in stock by vendor.
- Select "Report Only Negative QOH" to generate a report of all items with negative quantities.
Details
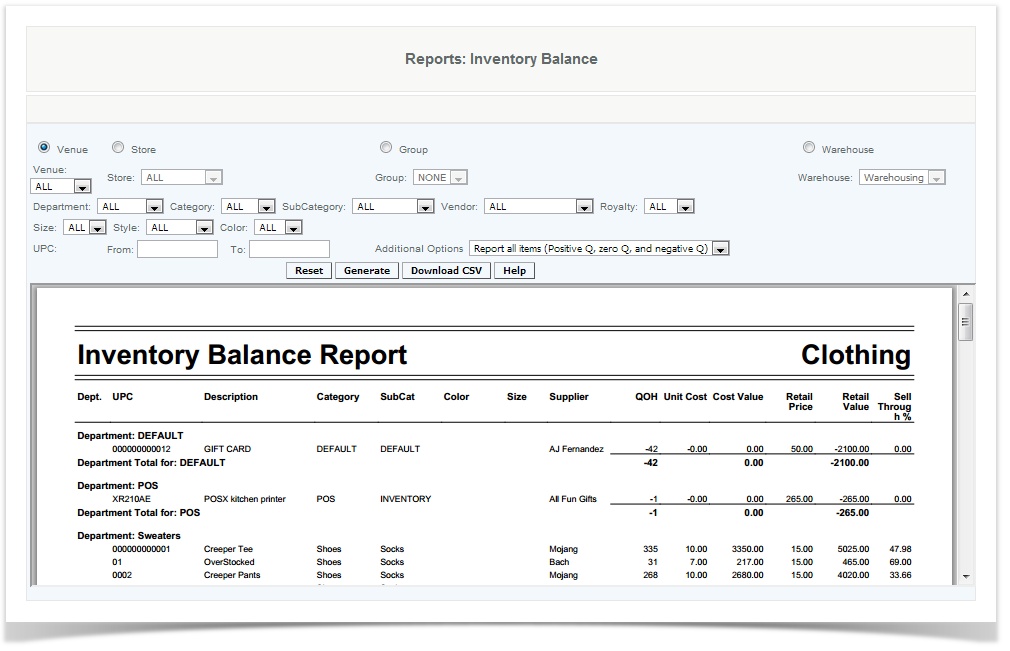
To filter Report by Venue, Store, Group, or Warehouse user selects the appropriate drop down.
To pull items by classifications user selects Department, Category, SubCategory, Vendor, Royalty, Size, Style or Color. Any combination selected will pull the appropriate items to the report.
To view the report from a begining UPC number to an ending UPC number in numeric order user enteres the beginning UPC into From: and the ending UPC into To:
Additional Options include the ability to filter items by inventory levels such as: Report all items; Report only items with negative QOH (quantity on hand); Report all items with a non-zero inventory.
The user then can generate the report or download the CSV file. Once a report is generated, the user can see the store, the warehouse, the department, the SKUs, and the description, category, sub category, supplier, quantity on hand (QOH), cost, cost value, retail price and sell through percent (the percentage of items sold off units available for sale) of each item listed.
The report generated in csv format, also includes attributes (style, color, size, brand, season)
Access
Access to this function at an enterprise level is limited by default to the System Administrator and Financial users only. Accounting, store managers, warehouse general managers as well as zone managers may view Inventory Balance report at Venues or Store assigned to them.
Item Lookup
Overview
The Item Lookup report displays by Royalty level and Category all the SKU items in inventory and where they are located within a Venue, Store or Enterprise. This can be used to create a report of where every item is located in a venue in the event that you wish to consolidate items from low volume store to high volume stores.
To forecast inventory requirements based on trends you can establish analysis rules and generate Reorder Level Reports .
Handy Hint
Use this report if you would like to see Inventory balances in a store by category.
Details
To filter Report by Venue, Store, Group, or Warehouse user selects the appropriate drop down.
To pull items by classifications user selects Department, Category, SubCategory, Vendor, Royalty, Size, Style or Color. Any combination selected will pull the appropriate items to the report.
To view the report from a begining UPC number to an ending UPC number in numeric order user enteres the beginning UPC into From: and the ending UPC into To:
The user then can generate the report or download the CSV file.
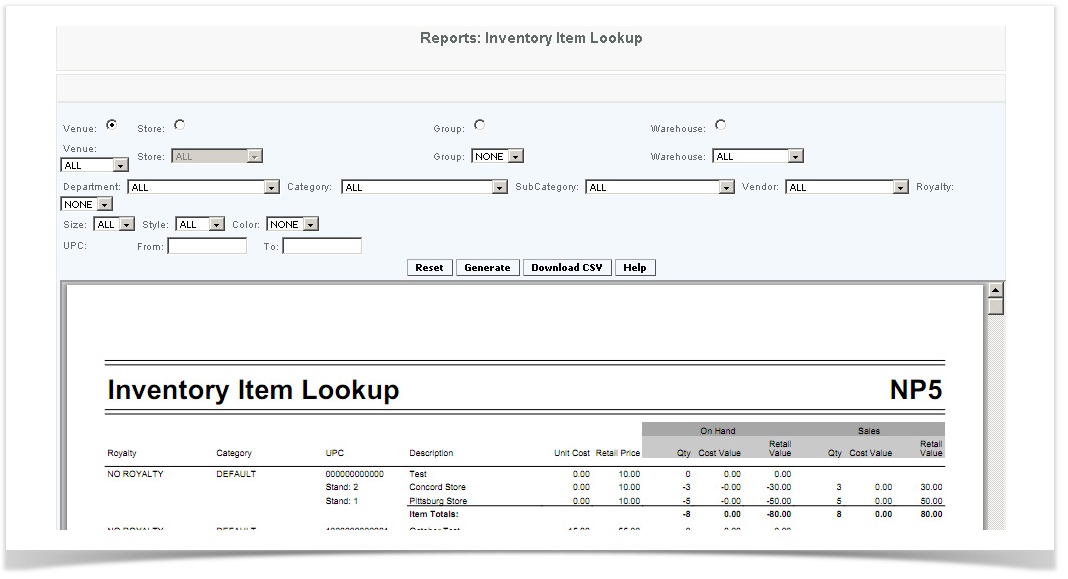
If the user generates a report, the report lists
Royalty - The name of the Royalty that is attached to the item
Category - the second tier of classification of the item.
UPC - Universal Product code for the Item. Under the UPC is what locations have the Item in-stock, Warehouse or stand.
Description - Show the name of the Item and the name of the Warehouse or (Store)Stand that the item belongs to. In the same column shows a row of the Item Totals. You can see the total of QOH, and the On Hand Cost, retail Values as well as the sales QOH, Cost, and Retail values.
Unit Cost - The cost of the Item that the user spent to get the item
Retail price- Price the User sells the item for
On Hand
Quantity - the QOH of the item in the specific location
Cost Value - The Unit cost multiplied by QOH
Retail Value - The Retail price muliplied the QOH
Sales
Quantity - The Quantity of the Item that was sold
Cost Value - The Cost Price multiplied by the Quantity that was sold
Retail Value - The Retail Price multiplied by the amount that was sold.
Access
Access to this function at an enterprise level is limited by default to the System Administrator and Financial users only. Accounting, store managers, warehouse general managers as well as zone managers and human resource managers may view Item Look Up report at Venues or Store assigned to them.
Inventory Adjustment
Overview
This report provides detail of inventory adjustments due to shrinkage or damage. You can run details on specific transactions here or you can also view or reprint the adjustment receipt .
Handy Hint
Run reports by stores and enterprise level reports to determine if certain items are more prone to shrinkage than others. Compare shrinkage to Periodic Sales reports to determine what the gross margin minus shrinkage numbers are for specific items or stores.
What is the impact of shrinkage on your Margin minus Labor , do any specific stores or venues skew those numbers?
Details
To filter Report by Venue, Store, Group, or Warehouse user selects the appropriate drop down.
Also adjustment can be consolidated by transactions.
To pull items by classifications user selects Department, Category, SubCategory, Vendor, Royalty, Size, Style, Color, Brand or Season. Any combination selected will pull the appropriate items to the report.
To view the report from a begining UPC number to an ending UPC number in numeric order user enteres the beginning UPC into From: and the ending UPC into To:
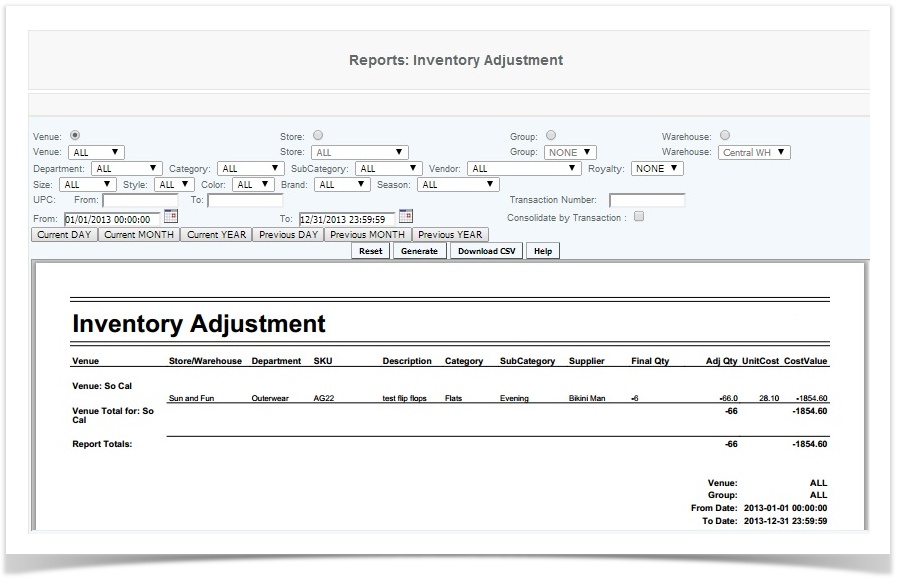
The generated report will provide
Venue - Name of the Venue
Store/Warehouse - Name of the Store or ware house
Department- Department name
SKU - The SKU of the item
Description - Description of the item
Category- Category of item
SubCategory - Subcat of item
Supplier - Name of vendor
Final QTY - Total amount in location
Adj QTY - Amount that was adjusted
Unit cost - Cost of item
Cost value - The cost of the item multiplied by the amount adjusted
This report displays which inventory and the quantity of inventory that has adjusted during a designated period of time.
Access
Access to this function at an enterprise level is limited by default to the System Administrator and Financial users only. Accounting, store managers, warehouse general managers as well as zone managers and human resource managers may view inventory adjustment report at Venues or Store assigned to them.
Bestseller List
Overview
The Best Seller Report has been enhanced to include vital business formulas to help you review your inventory mix. Not only does the report provide financial data on your top 50 selling items, but also the bottom sellers of your inventory. New filters have been added such as GMROI, Margin, and total sales to allow the user to look at their inventory from different angles.
It’s often more manageable to start by selecting a department and looking at the items within the department then analyzing the items, filtering by total sales and then by GMROI. Do any stand out either being identified as stronger than expected or in need of pricing adjustments
To determine reorder requirement use the Reorder Rules and the Reorder Level Report .
Handy Hint
Review the report periodically by Classification or Attribute, are you carrying similar product from different vendors? Would there any benefit in consolidating vendors that would result in better pricing or more attractive terms?
Details
To filter Report by Venue, Store, Group, or Warehouse user selects the appropriate drop down.
To pull items by classifications user selects Department, Category, SubCategory, Vendor, Royalty, Size, Style or Color. Any combination selected will pull the appropriate items to the report.
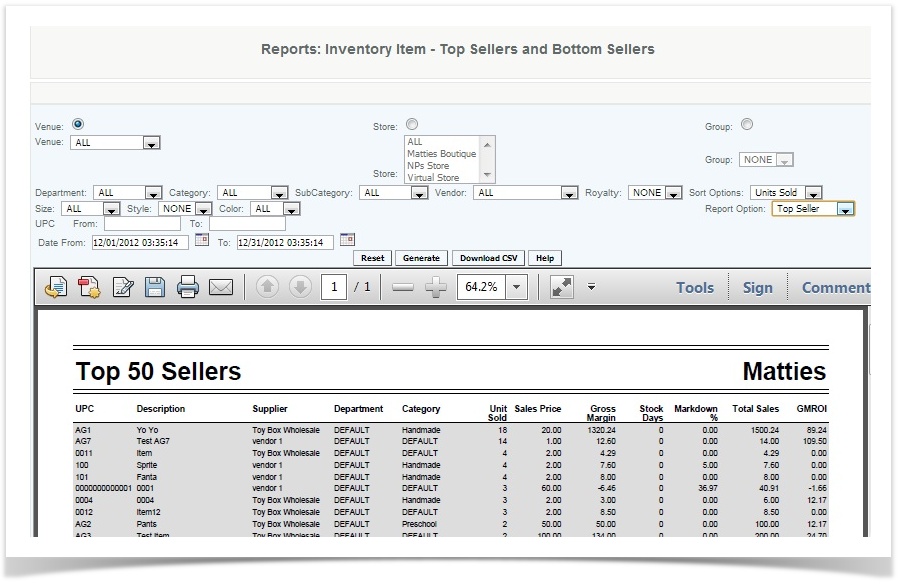
In the sort option, you will be able to sort the report by Units Sold, Margin, Total sales, and by GMROI
To view what items are being looked at you can select Bottom Seller or Top Seller from report option
To view the report from a begining UPC number to an ending UPC number in numeric order user enteres the beginning UPC into From: and the ending UPC into To:
User selects date range by selecting the Date From and Date To Calender and entering the appropriate dates.
The user then can generate the report or download the CSV file. The generated report contains the SKUs of the top 50 sellers, and the description (name), supplier, category, department, unit sold, and sales price of each item.
UPC - Universal Product code of the Item
Description - The Description of the Item
Supplier - Vendor
Category - Second tier of the items classification
Department - First Tier of items classification
Units Sold - Units of items sold
Sales Price - Retail price of the item
Stock Days -Stock Days is the number of days until the stock of the item is depleted. It is the average number of items sold per day (in the given date range)/quantity onhand.
Gross Margin - (Actual Sales after discounts before taxes- Cost of Goods Sold)
Markdown % - Discounted amounts/Extended Retail
Access
Access to this function at an enterprise level is limited by default to the System Administrator and Financial users only. Accounting, store managers, warehouse general managers as well as zone managers and human resource managers may view Bestseller List report at Venues or Store assigned to them.
Over Stock and Under Stock Report
Overview
The Over Stock and Under Stock Report can give anticipated information about the inventory. It provides details of the calculated life of an item, from the anticipated gross margin, anticipated GMROI, Stock Index, and sell out rate. Merchants will want to use this to gain an understanding of their inventory and what it is costing them to have those items. Beginning with GMROI (gross margin return on investment), which calculates the cost of having that item. Anticipated days to sell out calculates how long until you should sell out of the item without reorder. Stock index is the calculation that has been specifically created to show this information of items. For overstocked items these are the top 10% to sell out your mean inventory. Under stocked is the lower 10% of your mean inventory.
Details
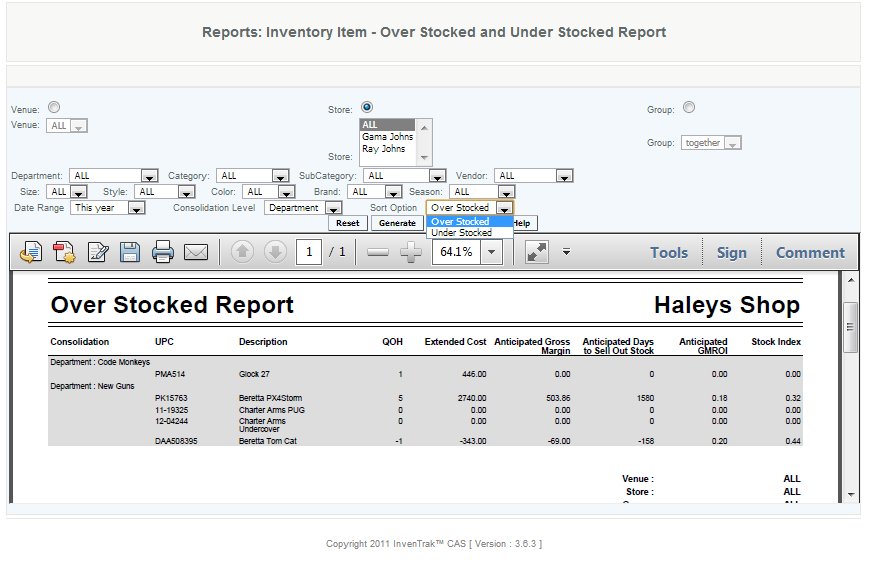
Users will want to use this report to give them an idea of what an item can do for their business. The understock shows items in high demand that need to be addressed either for reorder or moving stock. Overstock shows items that aren't selling to the highest potentials, from the calculations. These can be items that are holding space, or that need to be discounted or another promotion. These are calculations and can provide an insight into what the projected profit and stock days can be.
The calculations are as follows:
• Quantity on Hand (current inventory balance)
• Extended Cost: = Average cost per Unit * Quantity on Hand
• Anticipated Gross Margin: =((Extended Retail - Extended Cost) - historical markdowns at hierarchical (VSG level))
• Anticipated Days to Sell Out Stock: =Current Stock Balance/Average Sales per Day; Average Sales per Day = (Total Units Sold during Period/Number of Days in the Period)
• Anticipated GMROI: = Anticipated Gross Margin/ Extended Cost
• Stock Index is the calculation that is based on a bell curve fo your inventory. When using this equation it allows the calculations to show the top 10% of data as well as the lower 10% of data
Receiving Journal
Overview
This report provides by SKU a detail of all merchandise receipts.
Details
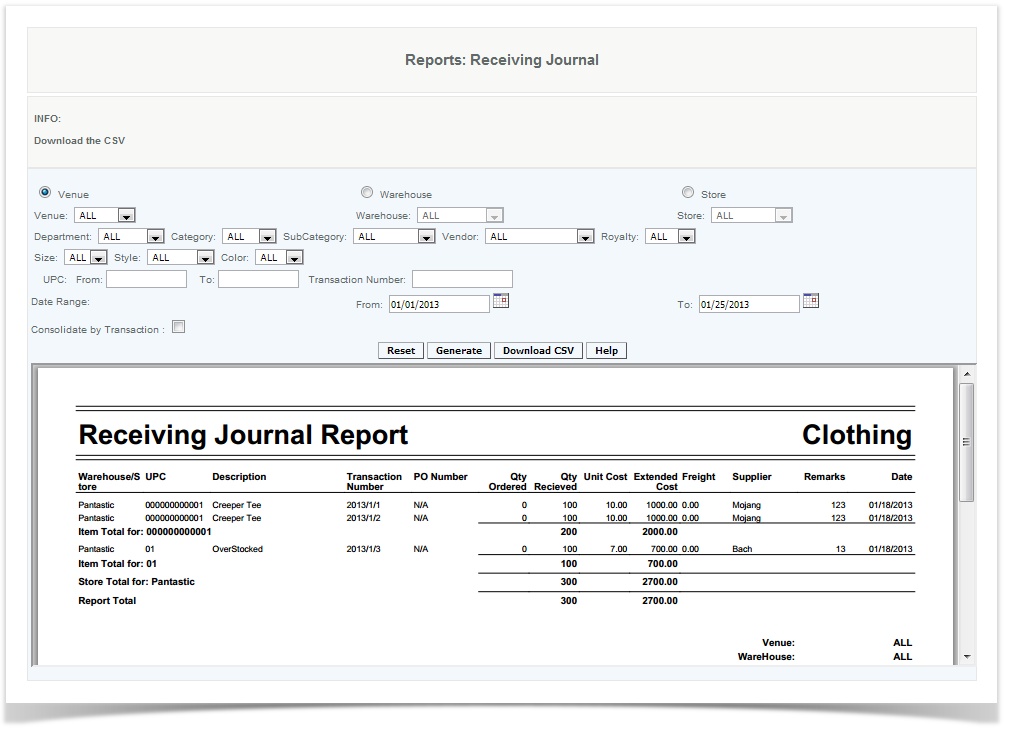
To pull the report by Venue, Warehouse or Store the user selects from the drop down menu for the appropriate resulting location
Also receiving can be consolidated by transactions.
To pull received items by classifications user selects Department, Category, SubCategory, Vendor, Royalty, Size, Style or Color. Any combination selected will pull the appropriate items to the report.
To view the report from a begining UPC number to an ending UPC number in numeric order user enteres the beginning UPC into From: and the ending UPC into To:
To view a known Transaction number the user enters the Transaction Number into the box.
User selects date range by selecting the Date From and Date To Calender and entering the appropriate dates.
The user can then generate the report or download the CSV file. The generated report contains the warehouse name, the SKUs, and the description, transaction number, PO number, quantity ordered, quantity received, unit cost, freight supplier, remarks, and the date of each transfer.
Access
Access to this function at an enterprise level is limited by default to the System Administrator and Financial users only. Accounting, store managers, warehouse general managers as well as zone managers may view receiving journal report at Venues or Store assigned to them.