Sales Reports
- Kevin Colaco
Real Time Sales
Overview
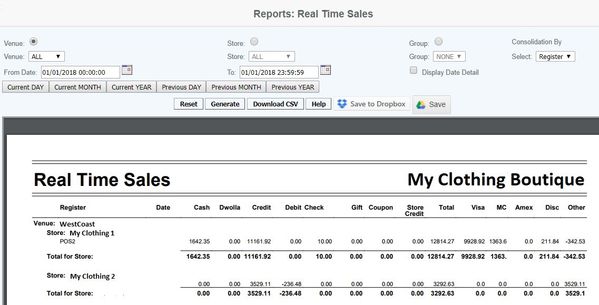
This report is used to generate sales data. The strength of the report is that it gives a snap shot of current sales data, broken down by media tender for a complete recap to be analyzed as needed by management.
Details
To filter by Venue, Store or Group user selects by clicking the appropriate drop down.
User can Consolidate the report by selecting Venue, Store or by Register from the Consolidation By drop down menu.
The report can be viewed with the totals from the date range selected, or enable the "Display Date Detail" To view the report broken down by day.
Select the date range from the 6 preselected options (Current Day, Current Month, Current Year, Previous Day, Previous Month, Previous Year) or select your own custom range using the beginning and ending date range calendars.
The user then can generate the report or download the CSV file. The generated report contains the registers, date, and the sales amount in cash, credit, debit, check, gift, coupon and totals for each register for the dates selected,. as well as the further breakdown by card types. The report is real time, so the report should match the daily sales summary of the POS immediately after a transaction has been made (depending on internet connectivity). Note - the figures include sales tax collected on the transactions.
Note: The coupons field displays transaction level coupons only. Item level coupons are reported on the coupon report.
Access
Access to this function at an enterprise level is limited by default to the System Administrator and Financial users only. Accounting, store managers, warehouse general managers as well as zone managers may view real time sales report at Venues or Store assigned to them.
Periodic Sales
Overview
The Periodic Sales report shows UPC level movement for a specified date range. It displays records of sales by UPC, including data on Quantity on Hand and Pending PO Quantity. This report can be useful in calculating replenishment levels.
Note
The "Quantity on Hand" reflected here is the inventory level as of the date the report is generated and not the inventory level as of the report ending date. The Total Retail Sales on the Periodic Report should equal the Total Net Sales on the /wiki/spaces/Dev/pages/1409121
Details
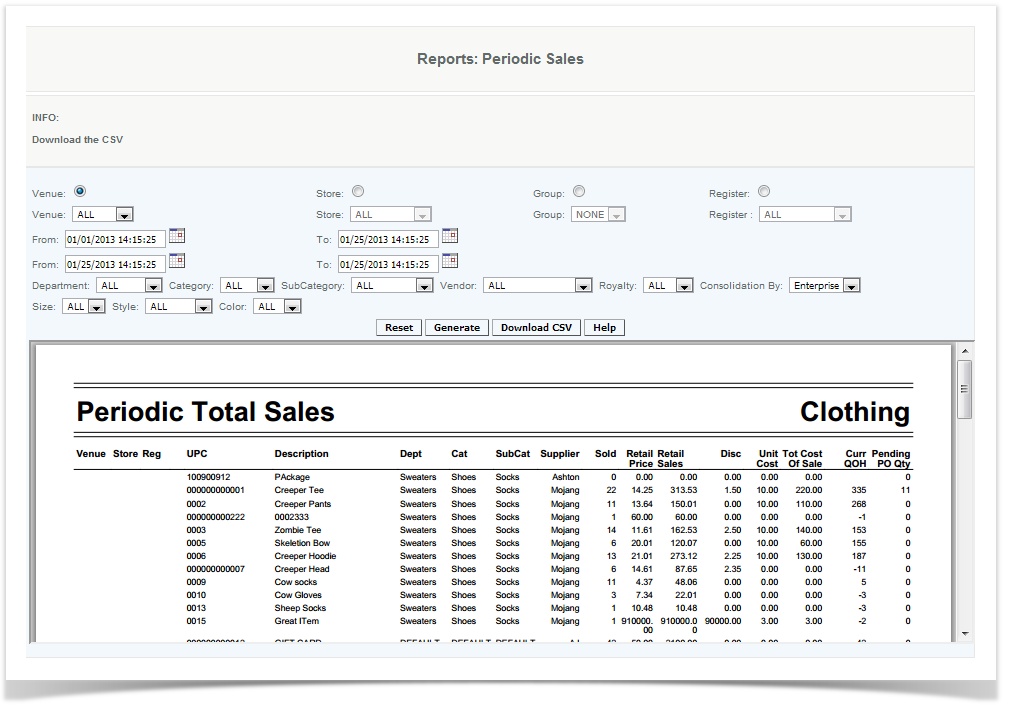
To filter by Venue, Store, Group or Register user selects by clicking the appropriate drop down.
User enters the date range using the pop up calendar for the From date and To date. To select another date range of data for the report the user selects from the From date and To date, this will enable the report to output from week 1 to week 3 skipping the days in between.
To output the report by classifications user selects Department, Category, SubCategory, Vendor, Royalty, Size, Style or Color. Any combination selected will display the appropriate items sold to the report.
User can Consolidate the report by selecting Enterprise, Venue or Store from the Consolidation By drop down menu. The report will display the quantity on hand (QOH) based on the consolidation selected. If the user selects the particular store and consolidating by venue then Venue level QOH will be displayed. If the user selects the particular store and consolidating by Enterprise then Enterprise level QOH will be displayed.
The user then can generate the report or download the CSV file. The pdf generated report displays the venue, store, register, UPCs, and the item description, department, category, subcategory, supplier, retail price, retails sales, discount, the unit cost, and total cost of sale of all units sold for each item. If run as a csv generated report, attributes (such as style, color, size) are also included in the report.
NOTE
On the report, the column titled Disc reflected discounts taken on the item, this is item level coupons and discounts.
Retail Sales is Net sales (as on DSR) sales tax not included
Unit Cost is from the postransactionitemdetail table.
Access
Access to this function at an enterprise level is limited by default to the System Administrator and Financial users only. Accounting, store managers, warehouse general managers as well as zone managers may view periodic sales report at Venues or Store assigned to them.
Total Sales
Overview
The Total Sales Report shows data in a matrix format by Royalty and Category Level, SKU and Discount Code.
It produces a Price Level Summary that provides a high-level review of total sales by sales price.
It also provides a Sub-Category Summary of the items produced by the customized query, enabling the user to determine which items are the sales drivers.
Be Careful
This is a report designed for a specific customer and the Tax data is calculated from the Tax tables.
Details
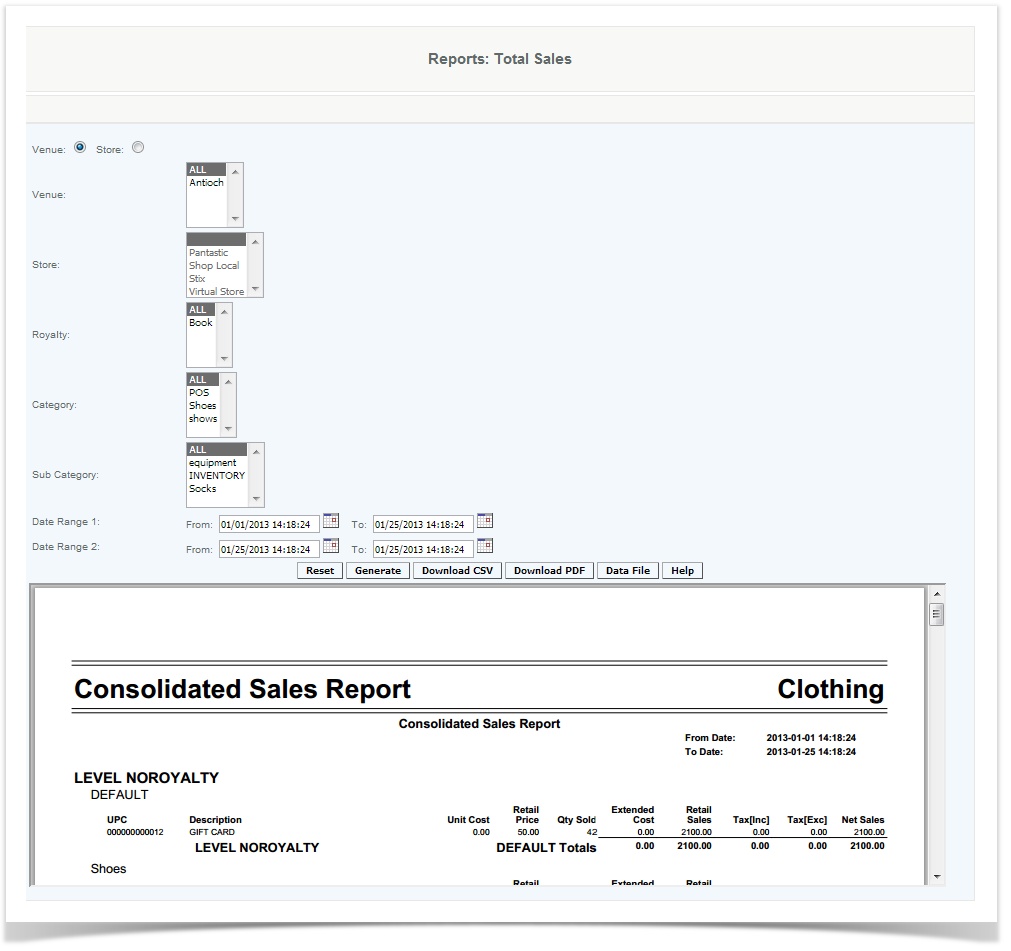
User creates a total sales report by choosing between venue or store and then selecting details for venue, store, royalty, category, and subcategory from drop-down boxes and providing the dates between which the sales are to be reported.
The user can then generate the report or download a CSV or PDF file. Generated report includes the unit cost, the retail price, the quantity sold, the extended cost (cost to company if items are refunded), the retail sales, the tax, included and excluded ( if the tax is included in the price, which is preset when the item is created in master item), and the net sales.
The Consolidated Sales Report has different summaries within the report. The first summary is broken down by categories then by UPC's. It reflects the unit cost which is how much the buisness spent on the item to retail price which is how much the business is selling it for. This also includes Tax[inc] where tax is inclusive in the item and Tax[exc] where the tax is based on the sale price. At the end of this summary it will show all totals that has no royalty. Users can use this report to find out the item which are sales drivers in their business.
Price Level Summary is reflecting pricing at the transaction level where the user can have the total at full price or their discounts added in ie: Holiday discount, new customer discount. User can use this to see how much these discounts are affecting their sales.
The final summary is the Sub-category summary where you can see which category is driving sales. Each category is then broken down and you can see the quantity sold, extended cost, retail sales, Tax[inc], Tax[exc] and net sales.
Note
Unit cost can be found in postrasactionitemdetail table.
Access
Access to this function at an enterprise level is limited by default to the System Administrator and Financial users only. Accounting, store managers, warehouse general managers as well as zone managers may view total sales report at Venues or Store assigned to them.
Projected Sales
Overview
This report is used to compare projected sales, transactions and labor costs versus actual numbers. Begin by loading the projected numbers using the Sales Projection User Interface or the Sales Projection File Import feature.
Handy Hint
Use this report with the Sales Summary or Periodic Sales to review the average items per transaction, also review the effectiveness or implementation of the Recommended Item program.
Details
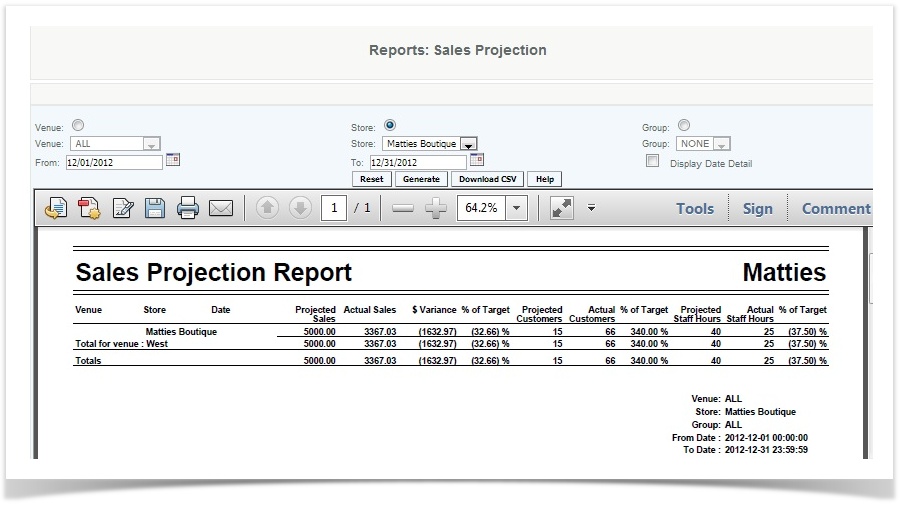
User provides details in the Sales Projection UI (or by import) and generates a projected sales report. User specifies the report by the venue, store, or group, and then provides the date range which the projected sales are to be reported.The user then can generate the report or download the CSV file.
The generated report provides the venue, store, date, projected sales, actual sales, dollar variance of projected sales versus actual sales, the percent variance of the target sales versus actual sales, projected customers, actual customers, and the percent variance of target amount of customers, the projected staff hours, actual staff hours, and percent variance of target staff hours.
Additional Data:
Data is populated from this report from the postransactions table and salesprojection table
Actual sales: This is net sales (as reported on the DSR) and does not include sales tax
Access
Access to this function at an enterprise level is limited by default to the System Administrator and Financial users only. Accounting, store managers, warehouse general managers as well as zone managers and human resource managers may view projected sales report at Venues or Store assigned to them.
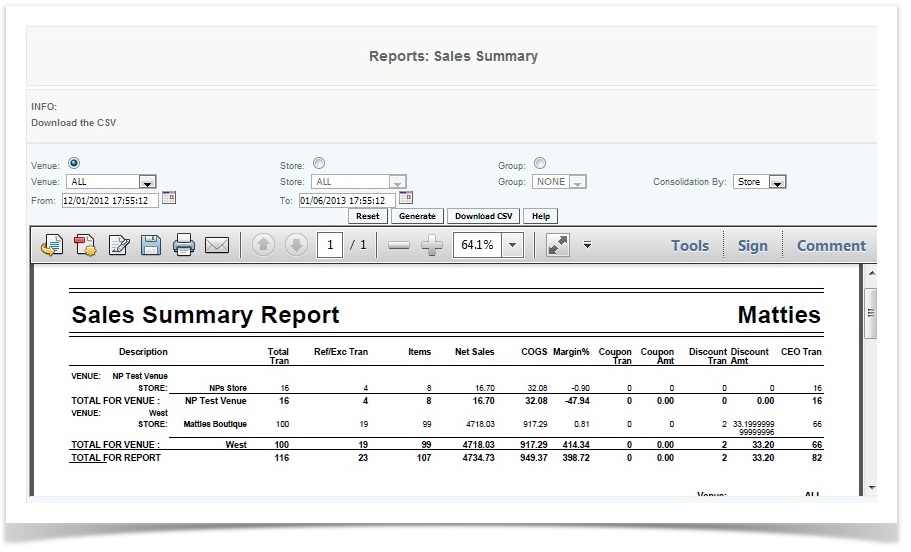
Sales Summary
Overview
This report provides an overview of the sales transactional activity. It should be used to get a quick overview of number of units sold per transaction, net sales, COGS , margin, coupons, discounts, and # of customer tracked transactions.
Handy Hint
Compare units per customers at various stores. Stores with are lower then expected could missing out on valuable opportunities to expand revenues. What is the impact of discounted transactions on margins; review the Discount report to see if certain items are being discounted more frequently than others.
Details
To filter by Venue, Store or Reporting Group user selects by clicking the appropriate drop down.
User enters the date range using the pop up calendar for the From date and To date. To select another date range of data for the report the user selects from the From date and To date, this will enable the report to output from week 1 to week 3 skipping the days in between.
User can Consolidate the report by selecting Venue or Store from the Consolidation By drop down menu.
The user then can generate the report or download the CSV file.
The generated report displays the following columns:
Description- breakdown of sort (Venue, store, etc)
Total Tran- Total number of transactions in the transaction period (refunds are added to total)
Ref/Exc Tran- number of refunds and exchanges made
Items- Net number of items that had been sold in the date range (refunds are subtracted from total)
Net Sales- Total of Sales less refunds/exchanges (does not include sales tax)
COGS - Total of cost of the items sold less refunds/exchanges
Margin%- Net Sales minus COGS divides by COGS
Coupon Tran- # of item level coupons used (coupons on refunds are added to total)
Coupon Amt- amount of item level coupons used (coupons on refunds are subtracted from total)
Discount Tran- # of transactions sold with a item level discount (Discounts on refunds are added to total)
Discount Amt-amount of item level discounts used (discounts on refunds are subtracted from total)
CEO Tran- Number of CEO transactions (customer is added to transaction)
Access
Access to this function at an enterprise level is limited by default to the System Administrator and Financial users only. Accounting, store managers, warehouse general managers as well as zone managers may view periodic sales report at Venues or Store assigned to them.
Sales Tax Settlement
Overview
This report provides a summary by tax codes of the number of items sold as well as the net sales and tax amount. This report can be used to aid the merchant in their tax remittance information.
Warning
The report is based in historical data on version 3.5 and above
Details
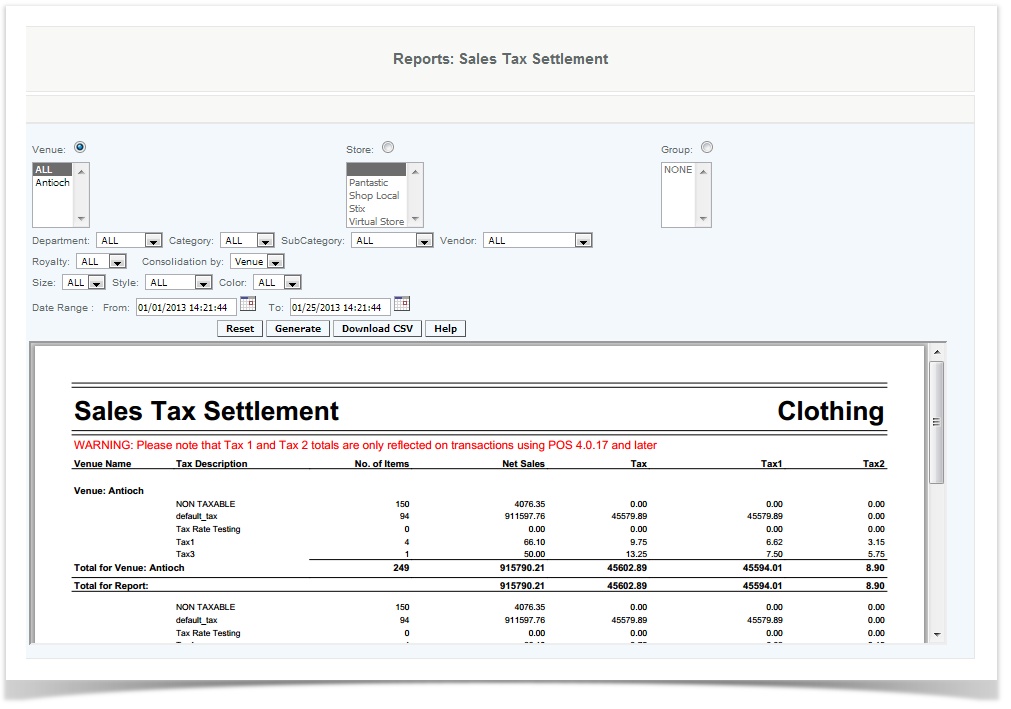
User provides details and generates a sales tax settlement. User specifies the report by the venue, store, group, and then provides details such as department and size, and selects consolidation by venue or store and the date range which the sales are to be reported.
The user then can generate the report or download the CSV file. The generated report provides the venue name, tax description (taxable, nontaxable, or exempt), number of items, net sales, tax 1, and tax 2 (if applicable).
Some municipal jurisdictions support two tax rates for certain products (typically liquor tobacco etc), or as in the case on New York City there are state and local taxes of which local taxes are waived during one week of the year. This allows the system administrator to manage the two rate tables if needed. The rates are calculated linearly or they can be compounded if required. For example suppose an item is sold for $100 and the tax rates are 10% and 2%. If linear the tax would be calculated as tax =($100 * (10% +2%))= $12 if compounded it would be tax =((($100*10%)+100)*2%)-100)=12.20.
Additional Data:
Data is populated on this report from the postransactions and postransactionsitemdetails tables.
Access
Access to this function at an enterprise level is limited by default to the System Administrator and Financial users only. Accounting, store managers, warehouse general managers as well as zone managers may view sales tax settlement report at Venues or Store assigned to them.