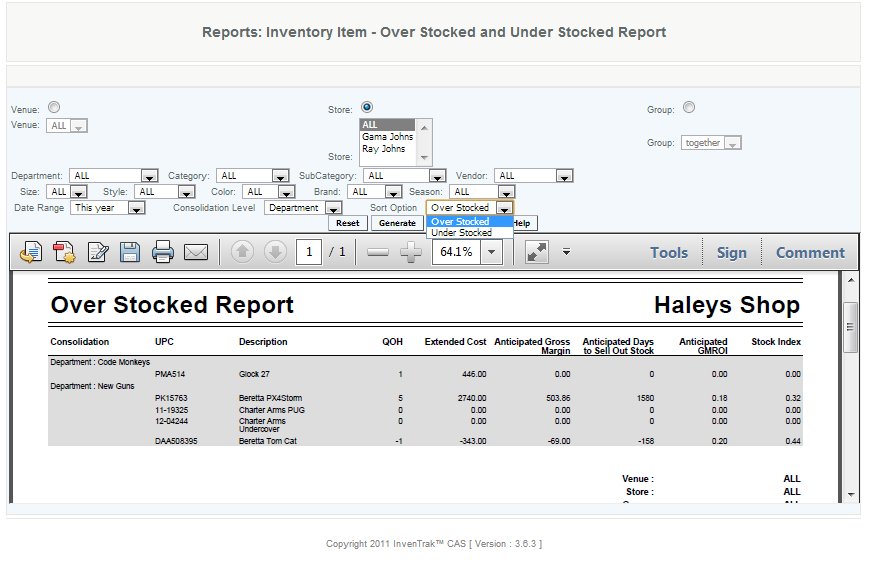
Over Stocked and Under Stocked Report
Overview
The Over Stock and Under Stock Report can give anticipated information about the inventory. It provides details of the calculated life of an item, from the anticipated gross margin, anticipated GMROI, Stock Index, and sell out rate. Merchants will want to use this to gain an understanding of their inventory and what it is costing them to have those items. Beginning with GMROI (gross margin return on investment), which calculates the cost of having that item. Anticipated days to sell out calculates how long until you should sell out of the item without reorder. Stock index is the calculation that has been specifically created to show this information of items. For overstocked items these are the top 10% to sell out your mean inventory. Under stocked is the lower 10% of your mean inventory.
Details
Users will want to use this report to give them an idea of what an item can do for their business. The understock shows items in high demand that need to be addressed either for reorder or moving stock. Overstock shows items that aren't selling to the highest potentials, from the calculations. These can be items that are holding space, or that need to be discounted or another promotion. These are calculations and can provide an insight into what the projected profit and stock days can be.
The calculations are as follows:
• Quantity on Hand (current inventory balance)
• Extended Cost: = Average cost per Unit * Quantity on Hand
• Anticipated Gross Margin: =((Extended Retail - Extended Cost) - historical markdowns at hierarchical (VSG level))
• Anticipated Days to Sell Out Stock: =Current Stock Balance/Average Sales per Day; Average Sales per Day = (Total Units Sold during Period/Number of Days in the Period)
• Anticipated GMROI: = Anticipated Gross Margin/ Extended Cost
• Stock Index is the calculation that is based on a bell curve fo your inventory. When using this equation it allows the calculations to show the top 10% of data as well as the lower 10% of data
