Overview -
...
erview
Information on Sales Analysis, Inventory Analysis, and Employee analysis
...


Details
Sales Analysis
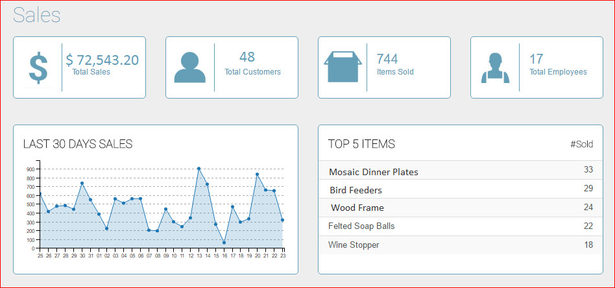
You can view sales either to date or as of year-end. These two graphs can be modified to a specific date range. Sales for the Week and Sales for the Day are also available for viewing. Another option is a bar graph that displays how much sales were made by month. The dashboard can also break down the current month by days to see daily sales. Lastly, you can track the top 5 selling items in your domain. This graph can also be modified to a specific date range.
Inventory Analysis
The first graph shows the number of inventory sold to date.
Employee Analysis
...
is available on the dashboard. The data covers the last 30 days, this date range is currently not modifiable.
Details
Top Picks
The top reports are four reports that give a quick indication of sales, CRM, items sold and employees
Sales Analysis
The Sales analytics show a graph of sales over the last 30 days. The other chart shows the top selling items over the past 30 days and the number sold during the period.
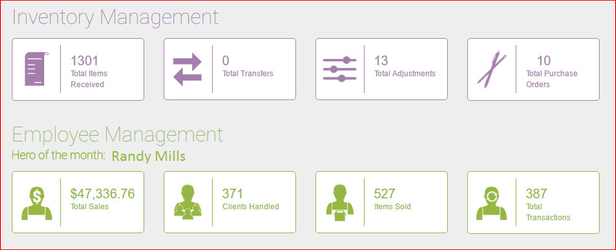
Inventory Management Analysis
Four graphs are shown with the following data, all reports reflect the last 30 days of activity:
Total items received into inventory
Total number of transfers completed
Total number of inventory adjustments completed
Total number of purchase orders
Employee Analysis
First the Hero of the Month is shown - We use a algorithm combining multiple factors to arrive at the Hero of the month.
Other data shown includes total sales by all employees, number of customers handled, number of items sold and total number of sales transactions